
Understanding the Fourier Series - a statistical point of view
One of the most important factors for understanding the phenomena found in day-to-day engineering is the deep knowledge of the tools and their natural functioning.
I mean, by natural, the intrinsic characteristics – the connection the tool has with nature, which appears only when we interconnect knowledge with other areas, in a multidisciplinary way.
The Fourier Series
The Fourier Series and its pair, the Fourier Transform, are essential tools in human life.
Algorithms created from these discoveries, such as DFT (Discrete Fourier Transform) and FFT (Fast Fourier Transform) made the digital world possible: internet, photos, videos, file compression and real-time calls are some examples of this.
We will step-by-step understand the succession of thoughts that made me understand the Fourier Series, step-by-step, which freed me from the mathematical definition and led me to the natural essence of its functioning.
Correlation – A statistical tool
Correlation is a statistical property that indicates the degree of relationship between two variables, the degree of similarity. In engineering, in the field of Digital Signal Processing (DSP), the means to estimate the correlation between two signals is the Cross Correlation.
The Cross Correlation, or, in the branch of vector mathematics, the inner product, is calculated with the point-to-point multiplication of the signals of interest. The sum of these multiplications will result in a scalar that directly indicates the degree of similarity between the two signals.
Cross-Correlation – A practical example
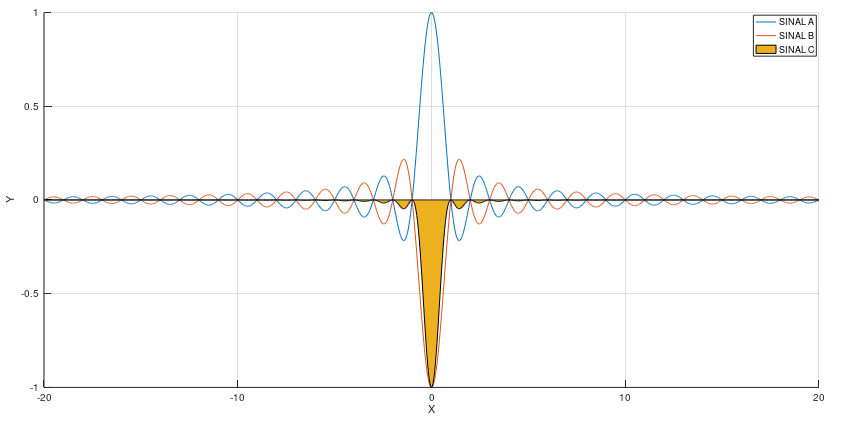
To visually appreciate how the correlation works, we will use three arbitrary signals: signal A, B and C. Both signals were generated with the same formula, arbitrarily chosen, slightly changing the parameters so that they are not exactly equal to each other.
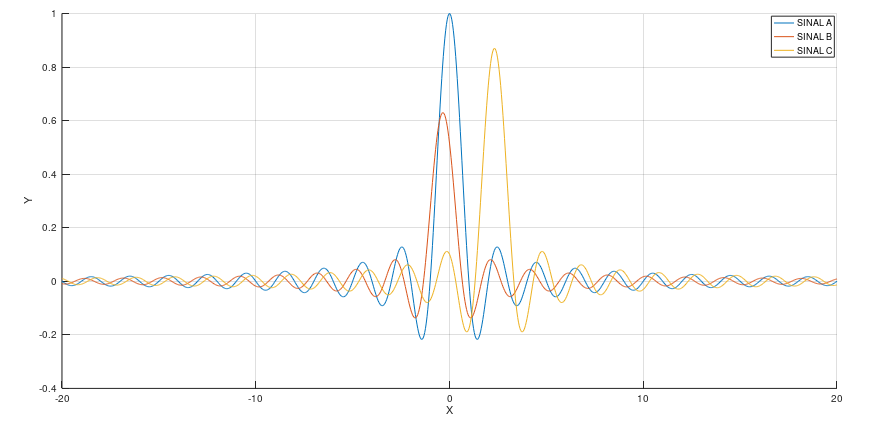
Sign A: Sign A, in blue, will be our reference. I selected a sin(x)/x function because it is visually elegant and will make it easier to understand.
Signal B: Signal B, in orange, is the same function sin(x)/x but with different amplitude and slightly shifted to the left.
Signal C: Signal C, in yellow, is the same function sin(x)/x but with amplitude closer to the reference and much more shifted to the right.
Visually, for us humans, signal B (orange) is much more similar to the reference (signal A – blue) than signal C (yellow), which is completely shifted. You see, both signals are generated by the same function, but they could be different signals.
The cross correlation should mathematically represent the difference in similarities between the functions.
Calculating the Cross Correlation
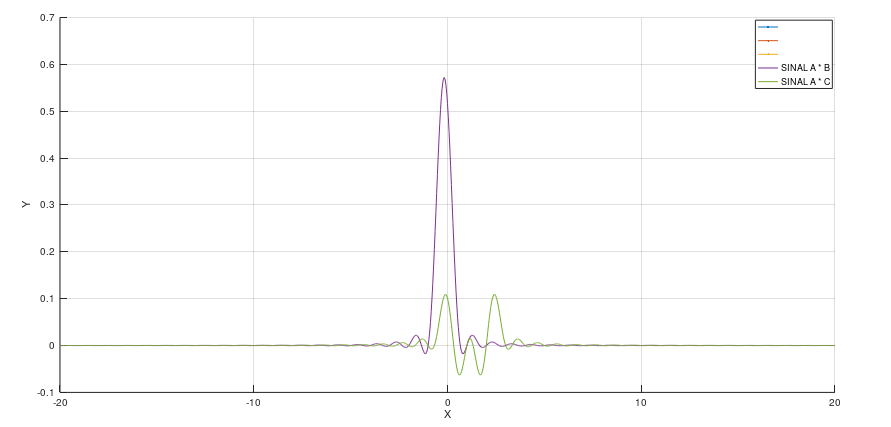
Above, we see the result of point-by-point multiplication between the reference and signal B (A * B) and between the reference and signal C (A * C).
Clearly, the A * B result has a much larger amplitude. A * C also has regions of negative amplitude, which may reduce the final result of the correlation, performed by the sum of the multiplied points.
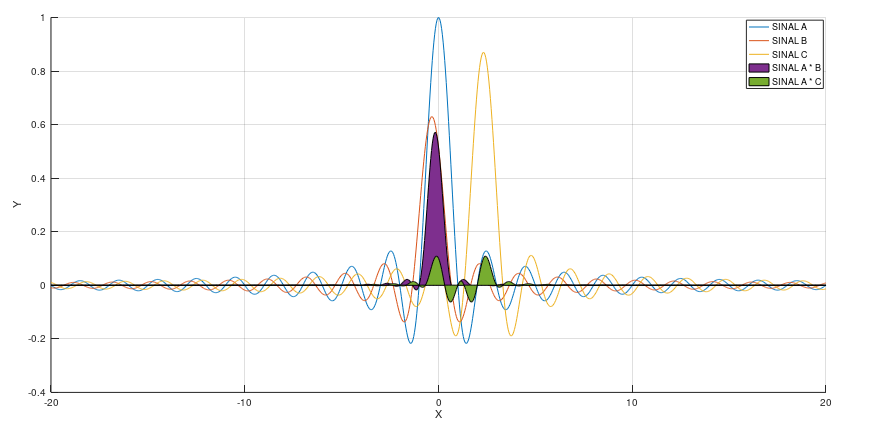
Of course, the sum of the points will be proportional to the area of the curves, which can be seen above. Below are the numerical results.
Correlation A -> B = SUM(A * B) = 12.867
Correlation A -> C = SUM(A * C) = 2.4646
The numeric results represent exactly what we had already noticed visually! B has more similarity to A than C. And that makes absolutely perfect sense, the signal B even though it is smaller in amplitude is MUCH more aligned with A than C.
Therefore, the results of the cross correlations are understood as:
“ A is more similar to B than to C ”
“ A has more of B than of C ”
That makes sense, doesn't it?
It does! When we multiply signals sample by sample, aligned signals will generate larger results, meaning they are more "aligned", thus they are more "similar". If the signs are very different, we will have negative and positive points, which when add will tend to a correlation of lower magnitude.
It is interesting to observe the result for when a signal is correlated with itself inverted, with its negative version.

All points are negative! They will add up to a large negative value, showing that the signals are very similar, in this case the same, but are inverted! Magic!
Relationship of the Fourier Series with the Cross-Correlation
The Fourier Series is the tool that decomposes a signal into sines and cosines elements. It is the tool that can tell us:
“This signal contains a sine at frequency F”
“This signal is similar to a cosine at frequency F2″
Wait there! It seems like correlation, it smells like statistical properties!
The Fourier series can be seen as a series of correlations
If we make the correlation of an arbitrary signal with a sine of frequency F, we will have the degree of its “participation” in the signal. The “participation” is the statistical similarity! That's exactly how much the signal contains that sine!
If we do this with a series of sines and cosines, we have each share in the signal, and that's exactly what the Fourier Series does.

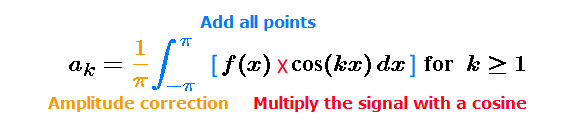
Each term Ak and Bk is the Cross Correlation – the degree of similarity – of the signal with a cosine of frequency k and a sine of frequency k, respectively.
The sinusoidal components of a square wave
We can perform Cross-Correlations with a well-known and popular signal in engineering, the square wave, to verify the operation of the Fourier Series on that signal, now that we understand its natural behavior.
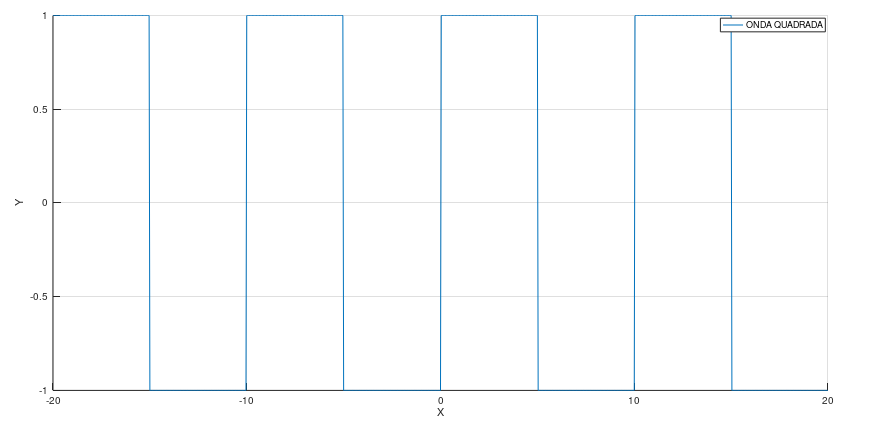
We will start our series of correlations with a sine that has the same period as the square wave signal, the result of the multiplication can be seen in the image below.
All points are positive! This means that the sine chosen has a high similarity with the square signal. Makes sense, that sine fits exactly inside the signal!
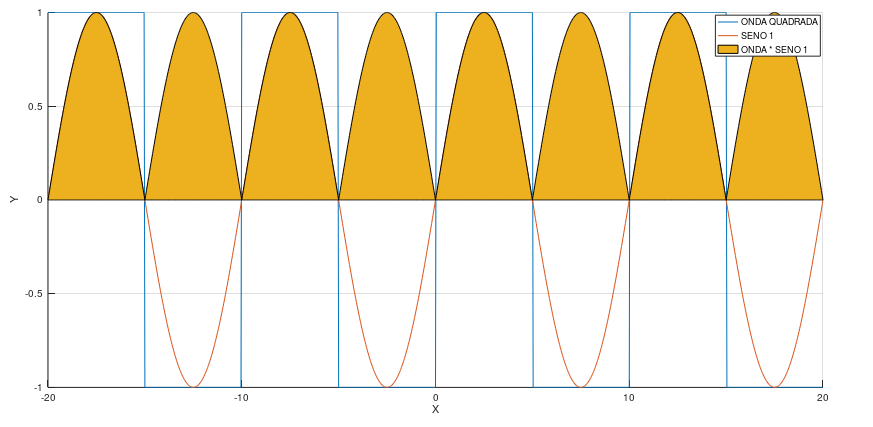
Using a sine twice the frequency, the result is quite different! We see positive and negative results by point-by-point multiplication. It's easy to see that the sum will be zero, as all the positives will cancel out the negatives, without exception.
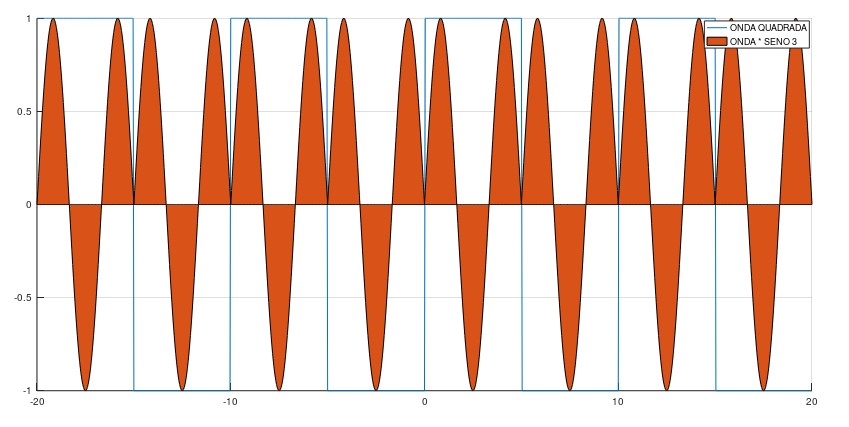
When we get to a triple frequency sine, something interesting happens with the correlation. Similar to the previous example, positives and negatives result. However, this time, the sum will not be zero.
It is evident that the sum of the points will not be null, because there will be a positive contribution greater than a negative one. We understand, then, that there is similarity between the square signal and a sine three times faster, but a LOWER similarity than in the first case, where the sine had the same frequency.
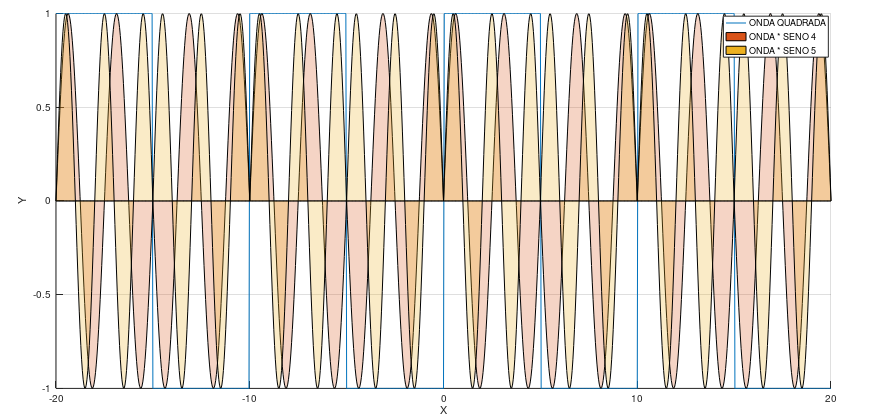
We can keep performing the analysis with sines of infinite frequencies. In this example, we will go up to the fifth multiple of the square wave. The result for sine(4 * F) will have positive and negative points in the same proportion, resulting in zero.
The fifth sine will have a slightly positive net sum. We see a pattern, apparently all even sines will result in a null correlation – this is easily observed graphically, think calmly by looking at the charts!
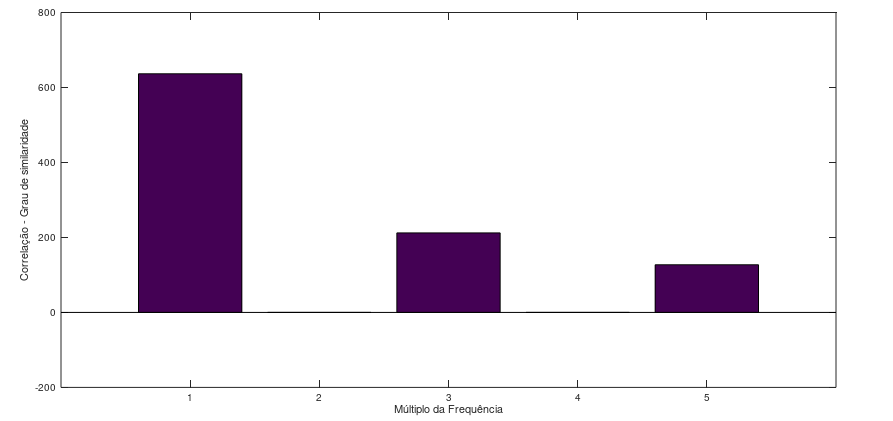
Jeez! This goes with everything we've ever learned! When we plot the result of the correlations on a bar graph, we have exactly the Fourier Series of the signal.
“The square wave is formed by the sum of its odd harmonics”
This is nothing more than: A square wave has a high degree of similarity to sinusoidal signals that oscillate at an odd multiple of its frequency. The similarity, in Fourier's view, is: "The square wave CONTAINS (...)" or "The square wave IS MADE OF (...)".
Conclusion
Well, we've had a long journey here! We understand the operation of the Cross Correlation graphically, we perceive the intrinsic similarity with the Fourier Series, and we prove that the square wave has, hidden inside, sine waves!
When I realized this natural relationship, I was in a boring statistics class at college. I got pretty happy. With this point of view, I later developed several algorithms that I used for signal processing.
I hope to come back to write more about it, to demonstrate nice trickes we we can play in DSP when we understand the Fourier Series in this way!